
邵俊明
![]()
开通时间:..
最后更新时间:..
First, we thank the reviewers for their positive comments and constructive suggestions. The main criticism is that we could have benchmarked better our proposed algorithm (i.e. Attractor). Therefore, here we provide supplementary materials for supporting the feedback of reviews. Thanks for spending a substantial amount of time looking over it in advance.
Here, we provide three experiments for better answering the questions of reviewers. The source code of our algorithm can be downloaded here: Code.
Except for the six state of the art algorithms (Ncut, Modularity, Metis, MCL, Louvain and Infomap), here we further report two other algorithms: Walktrap (Calinescu et al., J. Graph Algorithms Appl., 2006), SCD (Prat-Pérez et al., WWW’2014).
Finally, the performances of the nine algorithms are reported as follows.
(1). Synthetic Networks
 |
 |
| (a) Different intra-cluster edges | (b) Different average degree |
| Figure 1. The performances of different algorithms on the LFR benchmark networks. | |
(2). Real Networks
Table 1. The performances of algorithms on real data sets with ground truth.
| Zarachy | Football | Polbooks | Amazon | |||||||||
| NMI | ARI | Pur. | NMI | ARI | Pur. | NMI | ARI | Pur. | NMI | ARI | Pur. | |
| Attractor | 0.859 | 0.939 | 1.000 | 0.923 | 0.897 | 0.930 | 0.559 | 0.680 | 0.857 | 0.931 | 0.580 | 0.998 |
| Ncut | 0.833 | 0.882 | 0.970 | 0.923 | 0.897 | 0.930 | 0.534 | 0.645 | 0.829 | - | - | - |
| Modularity | 0.577 | 0.680 | 0.970 | 0.596 | 0.474 | 0.574 | 0.508 | 0.638 | 0.838 | - | - | - |
| Metis | 0.836 | 0.882 | 0.970 | 0.393 | 0.095 | 0.339 | 0.502 | 0.516 | 0.781 | 0.761 | 0.092 | 0.989 |
| MCL | 0.833 | 0.882 | 0.970 | 0.923 | 0.897 | 0.930 | 0.455 | 0.594 | 0.857 | 0.902 | 0.490 | 0.991 |
| Louvain | 0.524 | 0.541 | 1.000 | 0.858 | 0.807 | 0.870 | 0.440 | 0.537 | 0.857 | 0.738 | 0.384 | 0.384 |
| Infomap | 0.593 | 0.702 | 0.971 | 0.906 | 0.857 | 0.904 | 0.476 | 0.646 | 0.848 | 0.209 | 0.009 | 0.077 |
| SCD | 0.423 | 0.483 | 1.000 | 0.895 | 0.868 | 0.948 | 0.265 | 0.163 | 0.886 | 0.838 | 0.307 | 0.994 |
| Walktrap | 0.364 | 0.333 | 0.941 | 0.857 | 0.815 | 0.870 | 0.512 | 0.653 | 0.848 | 0.936 | 0.617 | 0.984 |
Table 2. The performances of algorithms on real data sets without ground truth.
| Collaboration | Friendship | Amazon | Road | |||||||||
| #C | mod. | ncut | #C | mod. | ncut | #C | mod. | ncut | #C | mod. | ncut | |
| Attractor | 1384 | 0.579 | 1179 | 8045 | 0.421 | 7325 | 23825 | 0.741 | 10811 | 59919 | 0.856 | 25055 |
| Metis | 1384 | 0.309 | 4217 | 8045 | 0.138 | 53984 | 23825 | 0.451 | 47336 | 59919 | 0.673 | 31542 |
| MCL | 2093 | 0.537 | 2103 | 13788 | 0.319 | 36723 | 46557 | 0.623 | 47488 | 86745 | 0.810 | 25065 |
| Louvain | 475 | 0.768 | 10.12 | 746 | 0.6839 | 38.34 | 240 | 0.926 | 9.617 | 492 | 0.989 | 2.032 |
| Infomap | 456 | 0.722 | 5.470 | 572 | 0.439 | 4.104 | 12 | 0.422 | 0.125 | 208 | 0.660 | 6.088 |
| SCD | 4902 | 0.426 | 2736 | 41964 | 0.245 | 17709 | 141736 | 0.495 | 59926 | 969812 | 0.115 | 53746 |
| Walktrap | 1295 | 0.663 | 418.5 | 6892 | 0.572 | 4290 | 14905 | 0.849 | 3224 | - | - | - |
(1) Community Size Analysis
The size distribution of detected communities on Amazon data set with different algorithms. Here the ground truth is known, which is plotted with solid red line. We can observe that Attractor allows finding small communities, and the size distribution of communities best matches the ground truth.

Figure 2. The performances of different algorithms on Amazon data.
(2) Noise level investigation
For all comparing algorithms execept MCL, they are not capable of handling outliers. Here, Attractor is compared with MCL in terms of local noise level, and the following figure shows the advantage of Attractor.
 |
 |
| (a) Attractor | (b) MCL |
| Figure 3. The comparison of Attractor and MCL on handling anomalies. | |
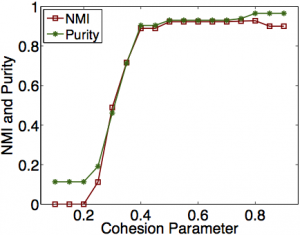
Here we test the sensitivity of cohesion parameter on real-world networks.
 |
 |
| (a) Football | (b) Polbook |
| Figure 4. The sensitivity of Attractor on Football and Polbook data sets. | |
